The last couple of weeks have been eventful for those studying the US economy, even apart from the surprising fall in longer term treasury yields. Federal Open Market Committee (FOMC) June meeting minutes were released, followed by Fed’s semi-annual Monetary Policy Report (MPR), US Consumer Price index (CPI) data for June and the Fed Governor’s testimonies to the Congress. These were important, particularly after the unexpected hawkishness at the June FOMC meeting where it acknowledged the possibility of inflation turning out to be higher and more persistent than expected. The minutes included various participants’ expectations for conditions to begin tapering asset purchases to be met somewhat earlier.
We break recent elevated CPI prints into its key contributors, look at signals from inflation at other points in the supply chain and analyse various inflation measures constructed by regional Federal Reserve Banks (FRBs) to better appreciate the nature of price pressures. We also look at the recent moves in various short and long term measures of inflation expectations to understand the aspects impacting them, whether it is getting unanchored and to understand how the Fed could look at it. Finally, we list factors which could reflect the transitory or persistent nature of inflation going ahead and thus should enable one to better comprehend the nuances of inflation and the Fed’s likely reaction.
All about economic reopening and demand-supply mismatch at the moment?
Headline CPI increased from 1.7% y/y in Feb20 (pre-pandemic) to 5.4% in Jun21. However, given strong base effects, we look at seasonally adjusted m/m numbers although typical seasonalities also have been impacted. By this measure, both headline and core (headline ex food, energy) CPI witnessed a strong 0.9% increase in June (Figure 1).
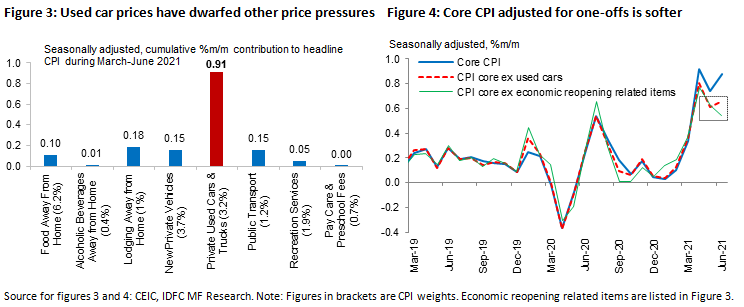
The main driver has been rise in prices of vehicles, particularly of used cars, and of other items linked to the ongoing economic reopening form March. Transport alone contributed 0.6% m/m of the 0.9% increase in CPI in June, and 1.8% of the 2.9% cumulative m/m rise in CPI during March to June. While demand has surged, low inventory of rental cars and the global semiconductor shortage has led to rise in prices of new and used vehicles. Goods have accounted for 60% of the rise in CPI during this period, while housing and transportation services have been major contributors within the other 40%. Thus, core CPI excluding reopening related items has been lower and in fact fell in June (Figure 4). Transitory?
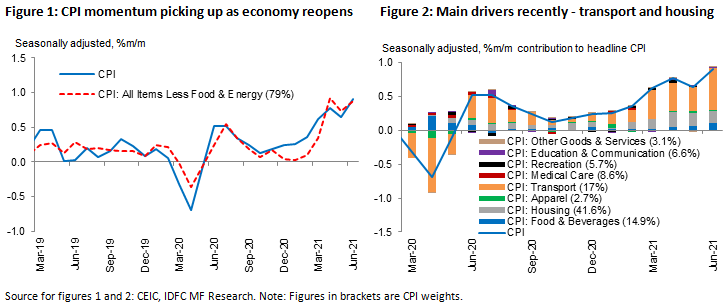
Important to bear in mind is price of houses are not part of CPI, as they are very long term assets. Rent prices are included but imputed rent of owner-occupied housing has a 23.6% weight in the CPI and normal rent has a 7.6% weight. While house prices have risen sharply owing to the demand-supply mismatch fueled by low mortgage rates, high savings, high input prices and labour shortage, CPI hasn’t yet materially reflected this and could have an upward push from likely future pressure on rents, ceteris paribus. For now, lodging-away-from-home has been a major contributor within housing.
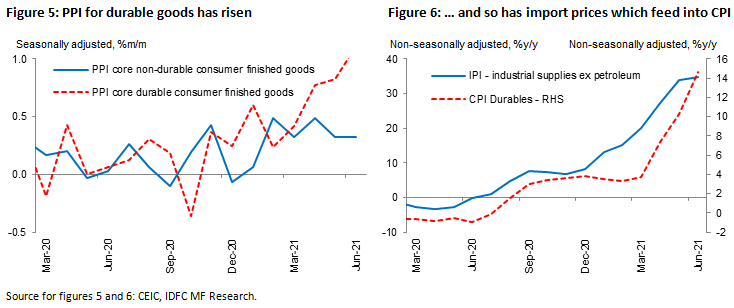
Fed’s preferred inflation measure, PCE (Personal Consumption Expenditures) price index, which differs from the CPI in terms of composition, weights, calculation methodology and data sources but better captures product/service substitution, convey the similar trend of higher price momentum in goods (mainly durables) over services from March to May.
Other measures of inflation in the supply chain – 1) PPI (Producer Price Index) of core durable consumer finished goods have risen sharply, thus flowing into CPI in addition to the surge in used car prices and 2) Rise in IPI (Import Price Index) of industrial supplies is very closely correlated to rise in CPI-durables (Figures 5 and 6). This reflects global input price pressures, semiconductor shortage, supply being unable to meet the surge in demand and delayed deliveries.
Are broader price pressures getting masked under the used cars phenomenon?
Spike in used car prices has undoubtedly dominated the recent narrative but evidence from various inflation measures of regional FRBs and our own work seems to suggest higher price pressures in other times are broader than before. Although ‘broad’ inflation need not always lead to ‘persistent’ inflation, particularly in the current economic scenario, it is still important to track the volume, magnitude and type of items witnessing price pressures to dynamically comprehend the nature of the transitory phase and any spillovers.
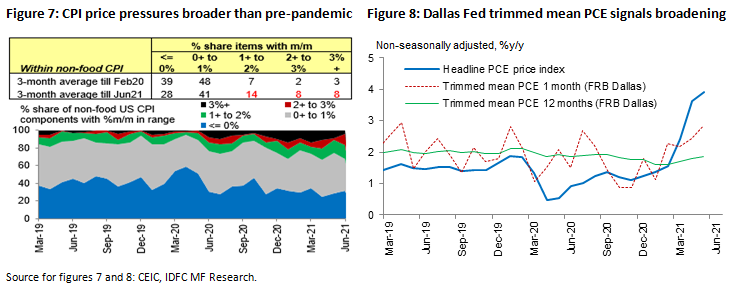
- Our study indicates, within non-food CPI, number of components in the higher m/m ranges has increased vs. pre-pandemic, but not drastically so far. Some portion of this would be expected given the context of economic reopening.
- Dallas Fed’s Trimmed Mean PCE inflation, often discussed by FOMC, trims out readings from lower and upper tails to reduce deviation from proxies of core inflation. This is now below the headline PCE price index and has moved up, indicating higher and rising price pressures. Dallas Fed points out that when this happens, narrow but extreme price pressures typically broaden even into goods and services whose prices typically move slowly.
- Median CPI constructed by FRB Cleveland (inflation rate of component in the 50th percentile of price changes) and the Underlying Inflation Gauge of FRB New York (which captures sustained moves in inflation based on a broad set of price, real activity, and financial data) have also been rising, which points to broader price pressures.
Recent price pressures not cyclical and also more Covid-sensitive?
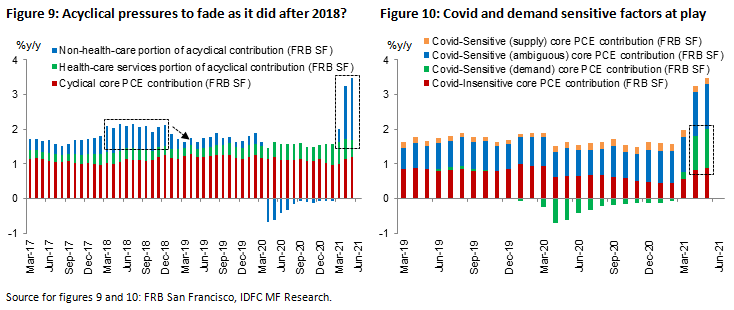
According to the San Francisco Fed, prices of cyclical items are more sensitive to economic conditions and thus monetary policy (42% of PCE – housing, recreational and food services, non-durables) while that of acyclical items are more sensitive to industry-specific factors (58% of PCE – health care and financial services, clothing). Accordingly, the recent rise in prices are driven by non-health acyclical factors which typically fade as it did after 2018 (Figure 9).
Another classification of inflation by the San Francisco Fed is into Covid sensitive and insensitive parts. The recent rise has been mainly driven by demand-sensitive components (quantity and price changed statistically significantly in same direction during Feb-Apr 20), while contribution of supply-sensitive (quantity and price changed in opposite directions in Feb-Apr20) and ambiguous components (either price or quantity changed statistically significantly but not both) have been quite steady (Figure 10). Does this imply inflation is driven by Covid induced demand pressures which could fall?
So, could it be that price pressures are beginning to broaden but items witnessing them are such that it could eventually fade, even if readings in the meantime are higher than previously expected and for a longer period? While there is no definite answer for this now, what would ultimately matter is whether long term inflation expectations get unanchored.
Short term inflation expectations rise but…
While market’s expectations are measured through breakeven rates, which is the difference between nominal treasury yield and Treasury Inflation-Protected Securities (TIPS) yield for various maturities, expectations of consumers, businesses and professional forecasters are measured through regular surveys.
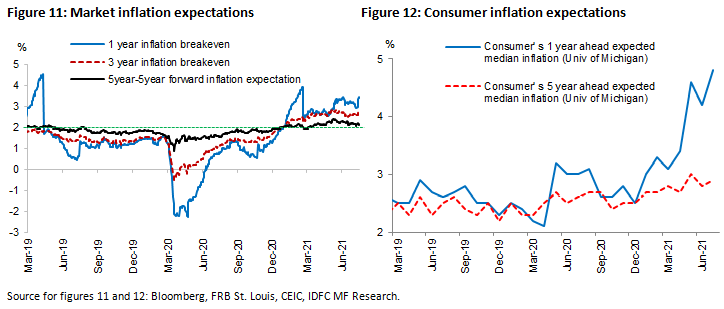
- Markets’ expected average inflation in the next 1 year (breakeven rate) has increased sharply while that for 3 years has increased lesser and for the 5-year-period-5-years-from-now has increased even lesser (Figure 11). Cleveland Fed’s model-based inflation expectations also show a similar trend. (Note: market breakeven rate reflects CPI while the Fed’s objective is stated in terms of the PCE price index which has averaged 25 ppts below CPI in the last two decades).
- Consumers’ expectation, typically volatile with even levels quite different from 2%, has increased more for the short term. The trend is similar in the survey by the University of Michigan and by the New York Fed (Figure 12). Important to note is uncertainty associated with these short term expectations, also part of the surveys, have increased considerably.
- Businesses’ expectations, measured by FRB Atlanta for the next one year, has been increasing from October 2020.
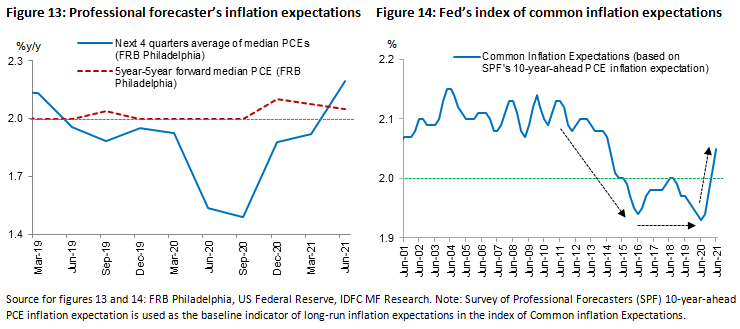
- Forecasters’ expectation, surveyed quarterly by the Philadelphia Fed (Figure 13), has continued to increase for the 1-year period while it has moderated for the 5-year-period-5-years-from-now, after rising in Dec20.
- Fed’s own index of Common Inflation Expectations (CIE) represents co-movement of 21 inflation expectation measures and particularly focuses on long term ones. This has moved up quickly from 1.9% in Sep20 to 2.1% in Jun21 (Figure 14).
Short-term expectations are, understandably, rising more than longer term ones as the former is more sensitive to incoming news and data. In Mar21, as part of their business inflation expectations survey, the Atlanta Fed noted that firms experiencing the most intense disruption tend to be those with the highest expectation of future inflation. Many firms part of the recently released Fed’s Beige Book, New York Fed’s Empire State Manufacturing Survey and the report released by National Federation of Independent Businesses continue to cite supply bottlenecks, higher input costs, domestic labour shortage, surge in demand and thus a spillover to selling prices.
However, longer term expectations are less sensitive to transitory factors and extreme events and thus directly anchored by monetary policy. These have risen only slightly above levels seen before the pandemic or those consistent with the FOMC’s 2% longer run inflation objective. The Fed’s semi-annual Monetary Policy Report expects this to return towards their objective but acknowledges the upside risks to the near-term inflation outlook. While the current rise could be partly welcome as the Fed has been dealing with lower inflation expectations (fell from 2012 to 2016 and stayed flat till the onset of the pandemic – Figure 14), the key would be whether near-term higher inflation experience (duration, magnitude, mix) will cause longer term expectations to rise materially and persistently above levels consistent with the Fed’s objective. This has not happened yet but recent research by the Chicago Fed suggests sensitivity of long-run inflation expectations can change suddenly and rapidly because it believes greater sensitivity in the wake of the financial crisis, combined with low realized inflation, could have contributed to the decline before the pandemic. This concern was also mentioned by several participants at the June FOMC meeting. Thus, whether long term expectations remain anchored will be crucial.
Gauging the Fed’s likely reaction – key themes and factors
- Narrow vs. broad inflation – As discussed, there seems to be some broadening beyond the surge in prices of used cars and items related to the economic reopening, indicated by share of components showing higher price momentum, Trimmed Means and Median inflation measures. However, it is important to understand that broadness need not necessarily cause persistence.
- Transitory vs. persistent inflation – Factors to track for persistence would be resolution of supply bottlenecks like the semiconductor shortage (there are very early signs of this based on PMI data but it could be likely meaningful only by late 2021 or early 2022), easing of durable goods consumption demand (as these are typically not purchased frequently), emerging price pressures (potential rise in rents in line with rise in house prices, oil and other commodity prices) and, very importantly, the progress in the labour market. Pace of job additions (post September when unemployment benefits fully cease, schools and day care centers reopen) and its impact on the current cycle of strong wage rises would be critical. Would wage rises prove sticky particularly if pace of job additions turns out to be slow? Could this then cause a new wage-price cycle?
- Cyclical/Acyclical and Covid Sensitive/Insensitive inflation – Prices of ayclical items, which typically reverse, and Covid (demand) sensitive items seem to driving recent inflationary pressures. How prices of these categories play out would need to be closely tracked to correctly define and comprehend inflation.
- Other factors – Deployment of higher household savings, path of the pandemic, vaccination progress and health concerns matter. With new cases slightly up (daily average 24,000 so far in July vs. 13,000 in June for US), how this evolves and impacts government response, global growth and thus the economic outlook and inflation is to be seen.
- What makes transitory period stronger and longer vs. what makes inflation persistent – Transitory phase of inflation has continued to surprise to the upside, which likely caused the hawkishness at the June FOMC meeting where the economic outlook was assessed to be stronger than previously expected. Persistence is different.
- How could the Fed likely assess persistence? It is the persistence of inflation, and not short term spikes like the ones being seen now, that would matter for the Fed. While CPI component readings could give a fair idea, a more fundamental and comprehensive assessment (vs. the Fed’s objectives) would be through the labour market and, most importantly, long term inflation expectations.
Disclaimer:
MUTUAL FUND INVESTMENTS ARE SUBJECT TO MARKET RISKS, READ ALL SCHEME RELATED DOCUMENTS CAREFULLY.
The Disclosures of opinions/in house views/strategy incorporated herein is provided solely to enhance the transparency about the investment strategy / theme of the Scheme and should not be treated as endorsement of the views / opinions or as an investment advice. This document should not be construed as a research report or a recommendation to buy or sell any security. This document has been prepared on the basis of information, which is already available in publicly accessible media or developed through analysis of IDFC Mutual Fund. The information/ views / opinions provided is for informative purpose only and may have ceased to be current by the time it may reach the recipient, which should be taken into account before interpreting this document. The recipient should note and understand that the information provided above may not contain all the material aspects relevant for making an investment decision and the security may or may not continue to form part of the scheme’s portfolio in future. Investors are advised to consult their own investment advisor before making any investment decision in light of their risk appetite, investment goals and horizon. The decision of the Investment Manager may not always be profitable; as such decisions are based on the prevailing market conditions and the understanding of the Investment Manager. Actual market movements may vary from the anticipated trends. This information is subject to change without any prior notice. The Company reserves the right to make modifications and alterations to this statement as may be required from time to time. Neither IDFC Mutual Fund / IDFC AMC Trustee Co. Ltd./ IDFC Asset Management Co. Ltd nor IDFC, its Directors or representatives shall be liable for any damages whether direct or indirect, incidental, punitive special or consequential including lost revenue or lost profits that may arise from or in connection with the use of the information.