We had previously highlighted our higher expected-CPI trajectory, for Q3 and Q4 of FY22, vs. the RBI’s December estimates (click here). Then, November CPI undershot our expectation mainly due to higher divergence vs. real-time and WPI data, particularly in the fuel and light category (explained here). December CPI was also a dovish surprise, driven by lower sequential momentum in core inflation. Q3 FY22 average CPI was thus 5% y/y vs. the RBI’s estimate of 5.1% and our early-December estimate of 5.4%. We now look at what surprised, what didn’t and what it means for Q4 FY22.
Dovish December after a Noteworthy November
In November, momentum in components like LPG, electricity and petrol was quite lower than real-time data available at the time of forecasting. In December, it was mainly weaker momentum in some of the components within core inflation, which was strong in October and November. One reason is that CPI component for mobile charges picked up only by 4.7% m/m, lower than the degree of passthrough we had estimated.
December also witnessed a contraction in the sequential price change of ‘Pan, Tobacco and Intoxicants’ and kerosene, another weaker-than-actual m/m LPG price change, unchanged electricity prices (after a 3.2% m/m contraction in November which was the highest ever in the current CPI-electricity series at a time when electricity prices were widely expected to rise due to power issues) and very weak momentum in transport items like air fare, bus/tram fare, taxi & auto rickshaw fare and school bus/van fare (which together have 2.3% weight in CPI). Some components like private tutor/coaching centre charges, gold and silver (which together have 1.8% weight in CPI) also sequentially contracted.
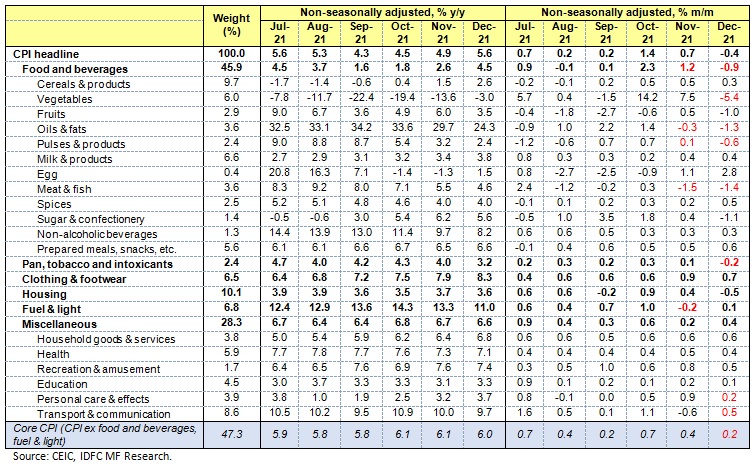
Figure 1: November and December CPI readings were dovish surprises – components and details
At a higher level
- – Momentum in goods ex food & beverages, fuel & light, petrol & diesel (21.6% weight) fell from 0.8% in November and an average 0.5% during previous three months to 0.2% in December. Momentum in services ex housing & mobile telephone charges (11.4% weight) fell from 0.4% in November to 0.1% in December. Thus, while both core goods and services contributed to the dovishness in the December print, goods contributed more due to the magnitude of its softness and higher weight in CPI
- Diffusion –Within the above two categories, share of total number of components with positive or flat m/m moderated very mildly from November to December. However, a similar share for weight of components with positive or flat m/m moderated much more for both, particularly for services. This implies a few components with high weights drove the dovishness within both the categories, i.e., it was more concentrated and less broad-based.
- Alternative measures – Core inflation momentum was milder in December but continues to chug along in y/y terms. It averaged 6% in the December quarter and 5.9% during April-December 2021. A simple exclusion-based measure – CPI ex potato, onion and tomato – stayed high and flat 6.4% in November and December.
Current drivers of the main CPI baskets
All said, December 2021 quarter CPI averaged below our expectation. This obviously implies sequential momentum of subsequent readings will be off a lower-than-expected base. First, some of the major CPI categories and the price pressures:
– Food and beverages (45.9% weight) – prices of vegetables, pulses, edible oils and sugar are continuing to fall in January. However, prices of wheat, egg, milk and prepared meals have been witnessing upside pressures. In the near term, extent of fall in vegetable prices would be the key given the typical higher magnitude.
– Fuel and light (6.8% weight) – apart from LPG and kerosene, it seems to be prudent to now wait for any future rise in WPI-electricity readings to consider passthrough to CPI.
– Clothing and footwear (6.5% weight) – rise in cotton yarn prices has been reflecting in the recent strong readings. GST rate hike on clothing has been deferred.
– Housing (10.1% weight) – largely following the usual seasonality and has been devoid of any recent surprises.
– Transport & Communication (8.6% weight) – reflected fall in petrol and diesel prices due to excise duty and VAT cuts in November but crude oil prices have been moving up more recently and retail prices in January have stayed almost flat vs. December. As already discussed, passthrough of telecom tariff hikes was likely incomplete in December and some part could reflect in January-February CPI, although total impact and exact timing is unclear.
– Household goods and services (3.8% weight) – some pressure in recent months from higher washing soap prices, in line with recent news on FMCG company price hikes, and domestic cook/servant charges.
– Recreation & amusement (1.7% weight) – main component is cable TV connection charge; volatile at times.
– Personal care and effects (3.9% weight) – spiked during previous covid waves, given major component is gold. It also includes toilet soap, toothpaste, cream, hair oil, shampoo, etc., prices of which have seen some recent strength.
In addition, the usual shared themes – oil price, services inflation, price hikes, etc. – continue to matter. There is currently no evidence of a strong wage cycle, given rural wage growth has been moderate and not broad-based. Although recent PMI data shows early signs of supply chains unclogging led by Asia, impact of the surge in Omicron infections, both domestically and globally (latter particularly given China is adhering to its zero covid policy), could put some upside pressure on inflation, particularly core inflation as witnessed during previous waves.
Factors and scenarios for the March quarter
We look at some scenarios for CPI in Q4 FY22 and the range of plausible outcomes. These reflect our current forecasts of CPI components, based on inclusion/exclusion and likely impact of some of the major factors (Figure 2).
Figure 2: India CPI inflation scenarios
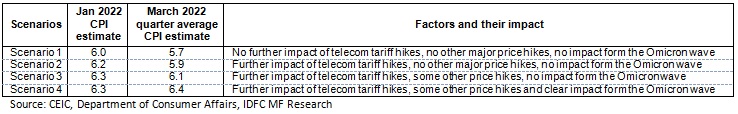
We see average inflation during the March 2022 quarter can range from 5.7%, if the fall in vegetable prices continue in line with seasonality and none of the other factors majorly impact inflation, to ~6.4% if further passthrough of telecom tariff hikes, other price hikes and rise in Covid infections all have an impact during the quarter. Thus, RBI’s estimate of 5.7% for the March quarter is currently at the lower end of the range. However, this is now within the realm of plausible outcomes in our view, unlike our earlier assessment of it being well below our expected range of outcomes.
Conclusion
November and December CPI readings were dovish surprises vs. our expectation, the former driven by divergence in some components from real-time & WPI data and the latter driven by milder momentum in core inflation, including a passthrough of recent telecom tariff hikes which looked incomplete. December dovishness was not quite broad and inflation excluding just the key vegetables stayed high. While we study the factors driving inflation for various CPI categories, it is important to consider shared underlying factors and the potential impact from the recent surge in Covid infections at a time when supply chains have just begun to unclog. To address this, we look at various scenarios and the corresponding range of possible inflation outcomes in Q4 FY22. We see the RBI’ estimate of 5.7% is towards the lower end of the range but possible.
Abbreviations:
Disclaimer:
MUTUAL FUND INVESTMENTS ARE SUBJECT TO MARKET RISKS, READ ALL SCHEME RELATED DOCUMENTS CAREFULLY.
The Disclosures of opinions/in house views/strategy incorporated herein is provided solely to enhance the transparency about the investment strategy / theme of the Scheme and should not be treated as endorsement of the views / opinions or as an investment advice. This document should not be construed as a research report or a recommendation to buy or sell any security. This document has been prepared on the basis of information, which is already available in publicly accessible media or developed through analysis of IDFC Mutual Fund. The information/ views / opinions provided is for informative purpose only and may have ceased to be current by the time it may reach the recipient, which should be taken into account before interpreting this document. The recipient should note and understand that the information provided above may not contain all the material aspects relevant for making an investment decision and the security may or may not continue to form part of the scheme’s portfolio in future. Investors are advised to consult their own investment advisor before making any investment decision in light of their risk appetite, investment goals and horizon. The decision of the Investment Manager may not always be profitable; as such decisions are based on the prevailing market conditions and the understanding of the Investment Manager. Actual market movements may vary from the anticipated trends. This information is subject to change without any prior notice. The Company reserves the right to make modifications and alterations to this statement as may be required from time to time. Neither IDFC Mutual Fund / IDFC AMC Trustee Co. Ltd./ IDFC Asset Management Co. Ltd nor IDFC, its Directors or representatives shall be liable for any damages whether direct or indirect, incidental, punitive special or consequential including lost revenue or lost profits that may arise from or in connection with the use of the information.