The US Fed Chair, at the annual Jackson Hole Economic Symposium on 27th August, noted the US economy has met the Fed’s test for “substantial further progress” on the inflation front and is making progress towards maximum employment. In our previous notes on the US economy (link 1, link 2), we looked at the pace of recovery in the labour market, short-term factors delaying it, the record-high number of job openings and also the demand-supply mismatch driving up inflation, through various price measures. While the broad narratives still hold, the contribution of durable goods to Consumer Price Index (CPI) inflation turned softer in July and non-farm payroll additions in August, when Covid infections increased there, was well below expectations. Additional pandemic-related federal Unemployment Insurance (UI) benefits ended this weekend, although some specific programs like state eviction protection, child tax credit, etc. have been extended which would at best provide partial relief for only a smaller section of the unemployed.
At this juncture of resurgence in Covid infections after the economy had started reopening and the labour market was recovering, ending of UI benefits and planned reopening of schools, we take a step back to assess the health of US households’ (HHs) income, spending, assets, debt and overall sentiment. We look at the impact from the pandemic, the government support and evolving consumer sentiment to assess likely household behavior ahead.
Personal Income – government support all along
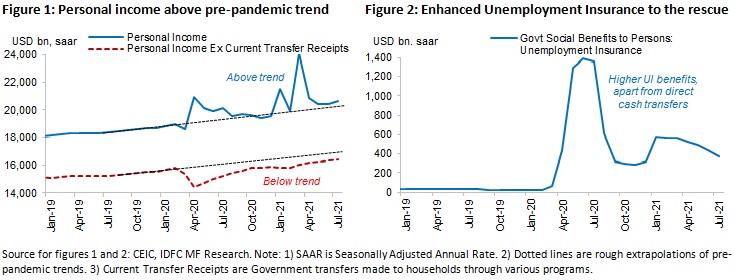
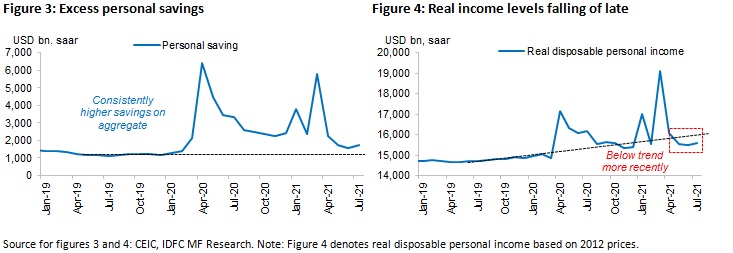
The US spent 25% of GDP as direct fiscal response to the pandemic, ~2.5 times the global average. With direct cash transfers and enhanced unemployment insurance, household income was well supported for about 1.5 years (Figures 1 and 2). This resulted in personal income actually rising and staying above the pre-pandemic trend levels. Consequently, households have saved an excess of ~USD 2.3tn during March 2020 to July 2021 (Figure 3). This is due to both government assistance, as cash transfers and enhanced UI, and reduced personal outlays (latter particularly during the early days of the pandemic). However, real disposable personal income has fallen below pre-pandemic trend levels since May, given the rise in inflation. It is to be seen whether this continues for a while given additional UI benefits have ended, Covid infections have risen (potentially impacting aggregate earnings) and if inflation continues to stay elevated, although wage growth could partly allay this.
It is important to note above observations are on an aggregate basis and need not be true for a particular section of households.
Personal Consumption Expenditure (PCE) – goods lead, services catching up but…
PCE data consists of goods and services consumption while retail sales is primarily about goods. As the economy reopened, consumption growth of goods was initially very strong but weakened, while that of services remained steady (Figure 5).
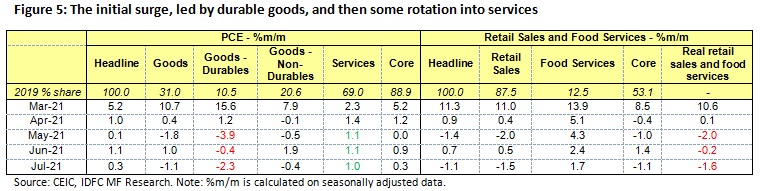
Retail sales also showed a similar pattern. Further, real retail sales and food services growth (deflated by CPI) has been negative since May. This reflects weaker consumption and stronger prices of goods, latter owing to supply bottlenecks, higher input costs, etc.
If we look at headline PCE level, it has been above the pre-pandemic trend since March this year, driven by durable goods (mainly motor vehicles) while services consumption is below trend but catching up (Figure 6). In fact, Core PCE (headline excluding food and energy) has been very close to its pre-pandemic trend since March, unlike headline PCE. Thus, on a real basis, Core PCE is quite lower than its trend, indicating the price effect within the recent rise in consumption (Figure 7).
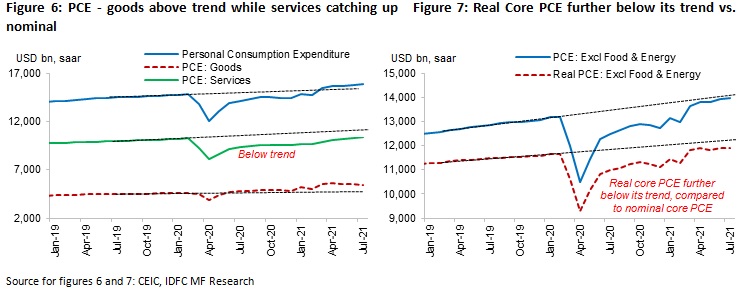
In terms of diffusion among sub-categories, almost all within goods are above trend while those within services are below. However, the impact of the recent surge in infections on the consumption-rotation from goods to services, and thus the catch up in services which was playing out, is to be seen. When new infections subside, will we see a mini pent-up goods demand cycle, before the services catch up resumes?
Wealth effect – easier debt servicing, higher assets and net worth
The rise in household debt outstanding, from Mar20 to Mar21, was higher than that during the same period in recent years However, this was mainly due to the rise in mortgage debt, triggered by higher savings and lower interest rates which reduced the debt service, i.e. ratio of principal and interest payments to disposable income (Figure 8). Non-mortgage household debt has remained close to its previous trend.
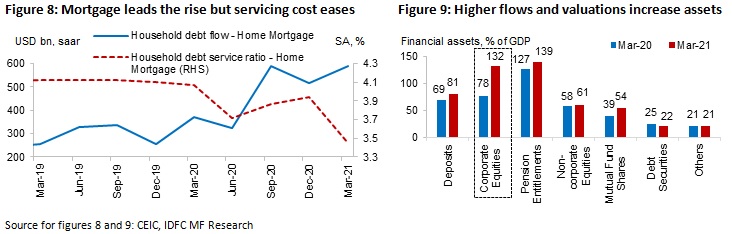
Assets increased too, with the increase in financial assets outstanding (~70% of total assets) being higher than that in tangible assets (mainly real estate). This was driven by rise in flows, mainly to deposits, and also the rise in value of corporate equities (increased by 54% of GDP from Mar20 to Mar21). Thus, net worth of households (assets minus debt) increased from 533% of GDP in Mar20 to 638% in Mar21. Given the health and economic uncertainty households still face, the boost from this wealth effect on incremental consumer spending may not be as strong during normal times. We now turn to various consumer sentiment indicators to understand this.
Still, consumer apprehension now on the rise
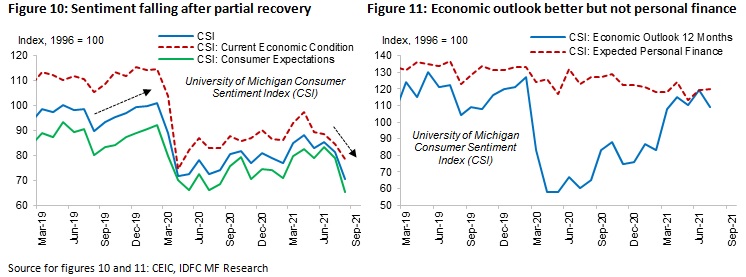
Consumer sentiment picked up well from Q4 2019, but has recovered only partially after Covid hit. This is understandable given higher aggregate unemployment, disparities in wages and uncertainties, although incomes were well supported by the government. However, sentiment (particularly on expectations) has fallen of late (Figure 10), even across higher income and lower age groups. Understandably, inflation expectations for the short term has been high for a while, but this has moved up further since May. It was also well known that enhanced UI benefits would end in September and some states could opt out earlier. Thus, despite economic expectations recovering quite well, personal finance expectations have continued to drift lower (Figure 11). In fact, number of respondents who expect their financial situation to be worse 1 year ahead has risen, while those who expect it to be better has stayed flat. This is despite excess savings and the wealth effect.
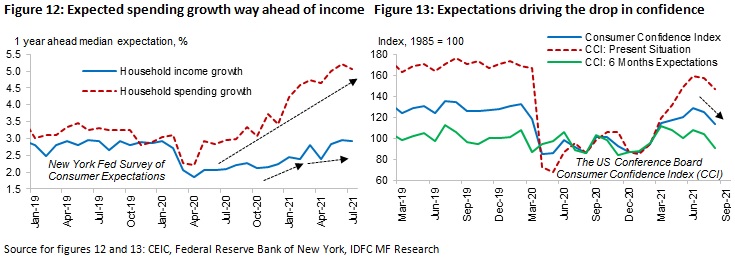
Consumer expectation of income and spending (Figure 12) further clarifies the situation. Household income is expected to grow mildly (in fact it flattened out a bit more of late) while spending growth is expected to increase much more sharply. The US Conference Board’s Consumer Confidence Index has also turned down of late, again driven more by the expectation component (Figure 13). All this points to rising apprehension among households, despite enhanced government support, higher personal income, savings and wealth all along, on aggregate.
What now?
As the pandemic hit, personal income actually increased due to substantial government support. This translated into excess savings as overall spending was also initially curtailed. Despite goods consumption, particularly of durables, soon rising above its pre-pandemic trend, services consumption lagged but has been improving. On a real basis, core PCE has actually been quite below its trend while disposable income has moved lower of late. Households also witnessed a rise in their assets and easier debt servicing, aiding a rise in net worth.
However, consumer sentiment evidenced through various surveys has weakened more recently. Ending of enhanced UI benefits this month (and known in the previous months to be approaching), recent surge in Covid infections, elevated uncertainty but expectation of one-year-ahead inflation to stay high and wage disparities among workers depending on race, education, age, sector employed, etc. are some of the main factors. The related uncertainties could also weaken the consumption boost from the wealth effect of higher savings and assets.
Thus, we are at a crucial juncture where households had been well supported directly and consumer sentiment partially recovered, but is now weakening. This will have implications for incremental consumption demand, spending from the accumulated excess savings, the consumption mix, inflation, policy response and thus the overall economic recovery.
Disclaimer:
MUTUAL FUND INVESTMENTS ARE SUBJECT TO MARKET RISKS, READ ALL SCHEME RELATED DOCUMENTS CAREFULLY.
The Disclosures of opinions/in house views/strategy incorporated herein is provided solely to enhance the transparency about the investment strategy / theme of the Scheme and should not be treated as endorsement of the views / opinions or as an investment advice. This document should not be construed as a research report or a recommendation to buy or sell any security. This document has been prepared on the basis of information, which is already available in publicly accessible media or developed through analysis of IDFC Mutual Fund. The information/ views / opinions provided is for informative purpose only and may have ceased to be current by the time it may reach the recipient, which should be taken into account before interpreting this document. The recipient should note and understand that the information provided above may not contain all the material aspects relevant for making an investment decision and the security may or may not continue to form part of the scheme’s portfolio in future. Investors are advised to consult their own investment advisor before making any investment decision in light of their risk appetite, investment goals and horizon. The decision of the Investment Manager may not always be profitable; as such decisions are based on the prevailing market conditions and the understanding of the Investment Manager. Actual market movements may vary from the anticipated trends. This information is subject to change without any prior notice. The Company reserves the right to make modifications and alterations to this statement as may be required from time to time. Neither IDFC Mutual Fund / IDFC AMC Trustee Co. Ltd./ IDFC Asset Management Co. Ltd nor IDFC, its Directors or representatives shall be liable for any damages whether direct or indirect, incidental, punitive special or consequential including lost revenue or lost profits that may arise from or in connection with the use of the information.