Imported tightening is a possible risk to RBI’s current accommodative monetary policy stance but is likely mitigated now for reasons we previously highlighted (click here). The Fed’s new framework places a high weightage on equitable job growth, does not link monetary policy action to only a headline employment number and thus focuses much more on the details of the labour market. The Fed adopted this based on its learnings from the later stages of the US economic expansion in 2018-19, when a strong job market co-existed without an unwelcome increase in inflation, and through its Fed Listens outreach program where it directly engaged with representatives of low- and moderate-income communities, minority groups, etc. The US labour market thus warrants being closely tracked to understand its structure, the hit from the pandemic, where it is currently headed, factors which are playing out and those to watch out for. Monitoring these helps gauge the likely reaction of the Fed and the market, and thus the risk to RBI’s monetary policy.
Before the pandemic – the best of both worlds
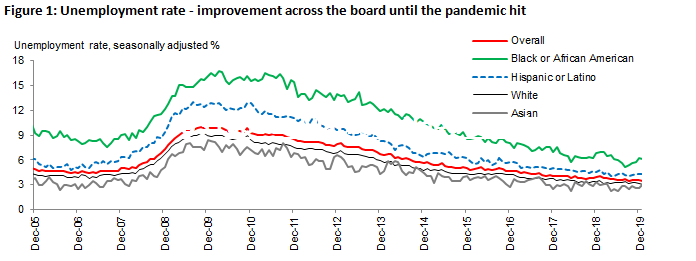
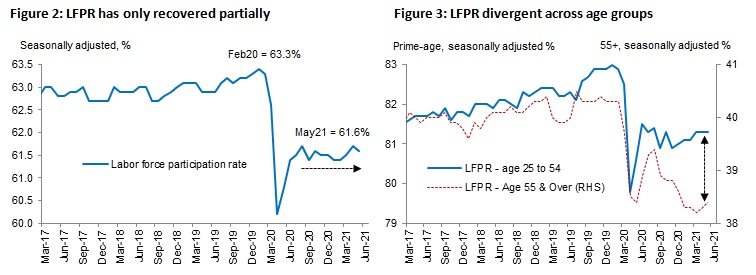
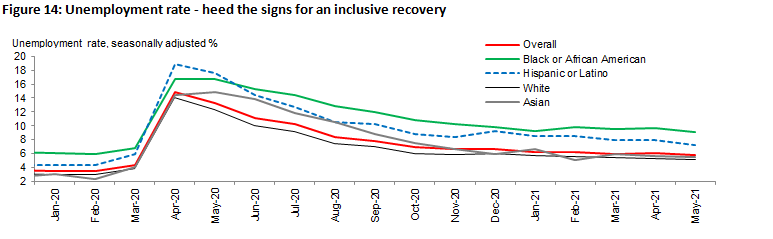
Average unemployment rate fell to 3.9% and 3.7% in 2018 and 2019, from 4.4% in 2017. Importantly, Labour Force Participation Rate (LFPR) increased from Sep18 to Feb20, after being flat for more than two years. This was even better for the prime-age category (25-54 years) LFPR, which was already on an upward trajectory from 2016 and picked up further in 2019. Average hourly earnings of private non-farm employees grew by 3% and 3.3% y/y in 2018 and 2019, after 2.6% in 2016 and 2017. Importantly, as the Fed had reiterated then, benefits of the economic expansion had started percolating to all parts of the society. Unemployment rate for various ethnic groups and races was falling since 2011 but the gap among them had become narrower in 2018-19 (Figure 1). All this while core PCE (Personal Consumption Expenditures) price growth (Fed’ s preferred inflation gauge) averaged 1.7% in 2017, 2% in 2018 and 1.7% in 2019.
Labour force – short-term factors delaying recovery?
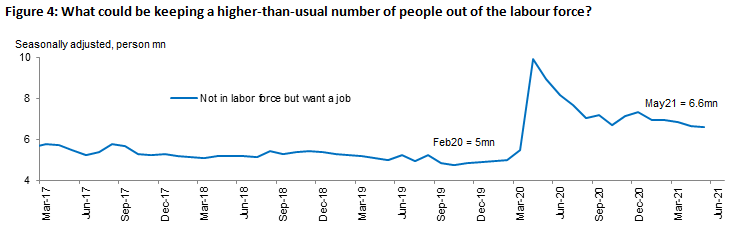
LFPR, after the dip in Apr20 and the immediate partial recovery till Jun20, has been moving sideways for almost a year now. Dissecting LFPR by age-group, the prime-age category has been flat for a year (because 35-54 has been flat although 25-34 has been recovering) while 55+ has fallen even below its Apr20 low. The number of people ‘not in the labour force but want a job’ is also 1.6mn higher than the pre-pandemic level and has remained so for a while now. The main factors which could possibly explain this are short-term in nature – perceived health risks and childcare requirements as schools haven’t fully reopened. It could also indirectly depend on spouse’s employment and UI (Unemployment Insurance) benefit status. If this is indeed the case, we could expect the LFPR to recover further once these factors ebb over the next few months.
Employment – slow recovery?
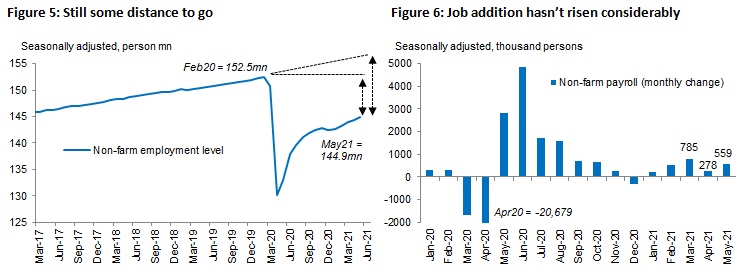
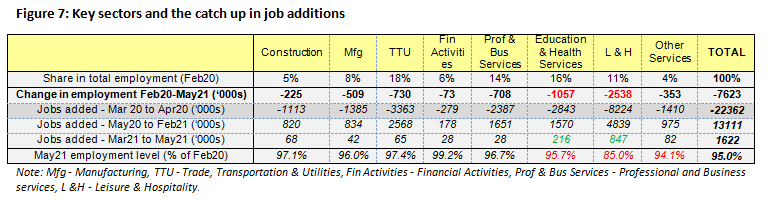
Non-farm employment level is currently 7.6mn below the pre-pandemic level. If we use the extrapolated pre-pandemic trend as reference, the shortfall is even higher. Payroll addition in recent months was below consensus expectations despite the economy gradually reopening from March. Possible reasons are the heavy UI benefits, intra and inter sector compositional shifts in jobs (as people’s preference could have changed), perceived health risks, child care needs and possibly even supply-side constraints which could dampen the demand for labour in the short-term.
By sector, Leisure & hospitality, Trade, transportation & utilities, Education & health services were the top 3 job losers when the pandemic hit. Job addition in services, initially lagging, has now started to increase. Leisure & hospitality, with lower wages and thus likely benefiting more from UI, has led the way here which raises the question of how big a factor UI benefits really are in discouraging workers from looking for jobs. However, while manufacturing and the less contact-intensive services have recovered to 96%+ of pre-pandemic employment levels, contact-intensive sectors have more to catch up.
Unemployment – long term damage and UI benefits
Unemployment rate was 3.5% in Feb20, 14.8% in Apr20 and is now at 5.8% in May21. Given it is defined as the ratio of the level of unemployment to labour force, change in latter (discussed earlier) impacts assessment. Thus, employment level or the employment-population ratio could be better indicators for now. However, rise in the number unemployed for 27+ weeks and the absence of a meaningful drop in permanent job losers warrant scrutiny. This possibly suggests 1) if one is unemployed for long, it is difficult to find a job (they could thus fall out of the labour force) and the number of such people are rising and 2) the drop in unemployment is not primarily driven by the fall in number of permanent job losers.
Re-entrants to the labour force also have increased unemployment. This is a positive as part of it could be those who were temporarily out of the labour force but wanted a job and thus still have a good chance of finding employment.
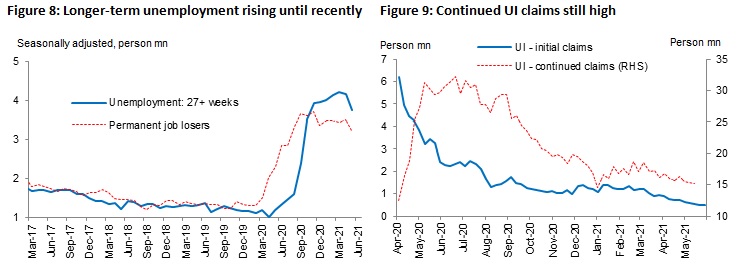
Although weekly initial filings for UI has been falling, total number of continued claims (under various unemployment compensation programs) is still above 15mn. While the pandemic-related additional federal UI-benefits end on 06th September 2021, some states have opted for an early exit. It is to be seen whether this increases the pace of job additions.
Employee earnings – base and composition effects
During Apr20-May20, when the pandemic hit, headline average hourly employee earnings actually picked up because employment of lower-wage (service) workers were disproportionately hit and they fell out of the average calculated. This base effect now works the opposite way to dampen the average as lower-wage service job additions are recovering. Thus, it is important to look at the sectoral trends. Increase in weekly hours worked, particularly among employees retained in private service jobs, also helped increase weekly earnings. Hours worked in manufacturing is close to pre-pandemic levels.
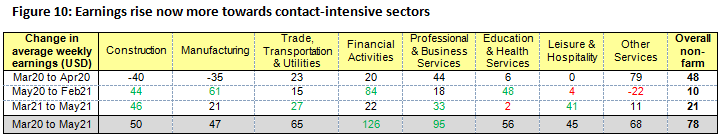
The highest cumulative rise in weekly earnings since Mar20 is in financial activities, professional & business services. Increase in earnings was initially more towards manufacturing and financial activities while it now also includes leisure & hospitality, construction, etc. Given job additions are likely to pick up as the economy reopens progressively, UI benefits cease and if factors which temporarily keep workers off the labour force abate, could services (particularly the contact-intensive ones) see some more wage pressure before it starts easing? Sectoral trends are to be watched too for any earnings pressure from pandemic-induced changes in job and wage preferences.
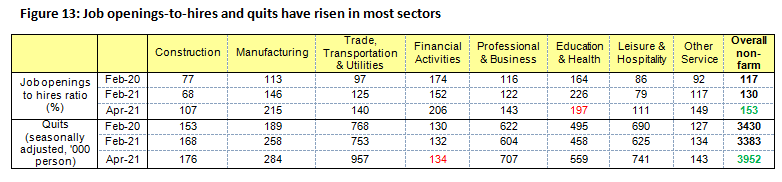
Rise in job openings and quits – job seekers’ market for the short term?
Job openings and quits have picked up while layoffs are now below pre-pandemic levels, as per JOLTS (Job Openings and Labor Turnover Survey). Anecdotal evidence suggests difficulty in hiring and offers of higher wages, particularly in construction and food & beverages industries. Thus, there is difficulty in both filling open positions and retaining employees. Could this point to workers having more job options (or having more confidence in finding jobs), time to choose till UI benefits expire and a change in job preferences?
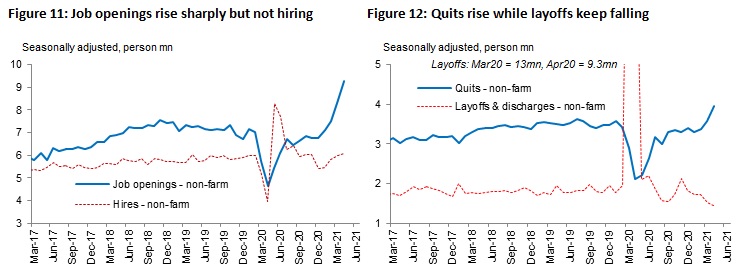
This phenomenon also seems to be quite broad-based across sectors, with only education & health services witnessing a recent fall in job-openings-to-hires ratio. Quits, only in financial services, have stayed flat recently but this is likely given the strong job additions and rise in weekly earnings during May20 to Feb21 (discussed previously).
Putting it all together
Labour force continues to be well below pre-pandemic levels, job addition has been slower than anticipated (although service jobs are making a comeback), continued UI benefit claims are still high while new ones have been falling and earnings in contact-intensive services have started to rise. However, both job openings and quits have picked up across sectors.
Lower labour demand from supply-constraints (to meet the sudden surge in demand from economic reopening) doesn’t seem to be a major contributor to labour shortage as job openings are rising. All pandemic-related additional UI benefits will expire in early September, perceived health risks will further abate if infections don’t rise and vaccinations progress, and child care requirements will abate if schools and child-care centers reopen as scheduled. The tailwind these factors offer for job additions, the impact on wages and the inclusiveness of all this across sectors are to be closely watched.
If job additions rise as these factors abate, it should help dampen aggregate wage pressures, ceteris paribus. However, divergence among sectors on the strength, timing and duration of wage pressures will be important to track as more clarity emerges on the job-composition shifts caused by the pandemic (e.g. change in requirements as businesses adapt, reluctance of labour to get back to similar jobs as before, whether these are short or medium-term trends, skill mismatches it could create, etc.). This will have implications for inflation as well.
The interplay of all the above factors is likely to have created the dichotomy that exists within the labour market today – high number of job openings and quits which typically indicate a tight labour market but the fact remains the economy is still 7.6mn short of its pre-pandemic non-farm employment level and recent job additions have been below expectations. Will this widen before it gets better? If so, will the rise in wages till the likely pick up in job additions be stronger and will this prove sticky? The next few months will thus be crucial. The Fed, under its new policy framework, will also be watching very closely whether the labour market recovery is equitable (Figure 14).
Note:
- Source for all figures: CEIC, U.S. Bureau of Labor Statistics (BLS), IDFC MF Research
- Abbreviations: RBI – Reserve Bank of India, USD – U.S. Dollar
- Definitions: Labour force – Sum of employed and unemployed (i.e. working or actively seeking work); LFPR – Labour force as a percent of the population; Unemployment rate – number unemployed as a percent of the labour force
Disclaimer:
MUTUAL FUND INVESTMENTS ARE SUBJECT TO MARKET RISKS, READ ALL SCHEME RELATED DOCUMENTS CAREFULLY.
The Disclosures of opinions/in house views/strategy incorporated herein is provided solely to enhance the transparency about the investment strategy / theme of the Scheme and should not be treated as endorsement of the views / opinions or as an investment advice. This document should not be construed as a research report or a recommendation to buy or sell any security. This document has been prepared on the basis of information, which is already available in publicly accessible media or developed through analysis of IDFC Mutual Fund. The information/ views / opinions provided is for informative purpose only and may have ceased to be current by the time it may reach the recipient, which should be taken into account before interpreting this document. The recipient should note and understand that the information provided above may not contain all the material aspects relevant for making an investment decision and the security may or may not continue to form part of the scheme’s portfolio in future. Investors are advised to consult their own investment advisor before making any investment decision in light of their risk appetite, investment goals and horizon. The decision of the Investment Manager may not always be profitable; as such decisions are based on the prevailing market conditions and the understanding of the Investment Manager. Actual market movements may vary from the anticipated trends. This information is subject to change without any prior notice. The Company reserves the right to make modifications and alterations to this statement as may be required from time to time. Neither IDFC Mutual Fund / IDFC AMC Trustee Co. Ltd./ IDFC Asset Management Co. Ltd nor IDFC, its Directors or representatives shall be liable for any damages whether direct or indirect, incidental, punitive special or consequential including lost revenue or lost profits that may arise from or in connection with the use of the information.